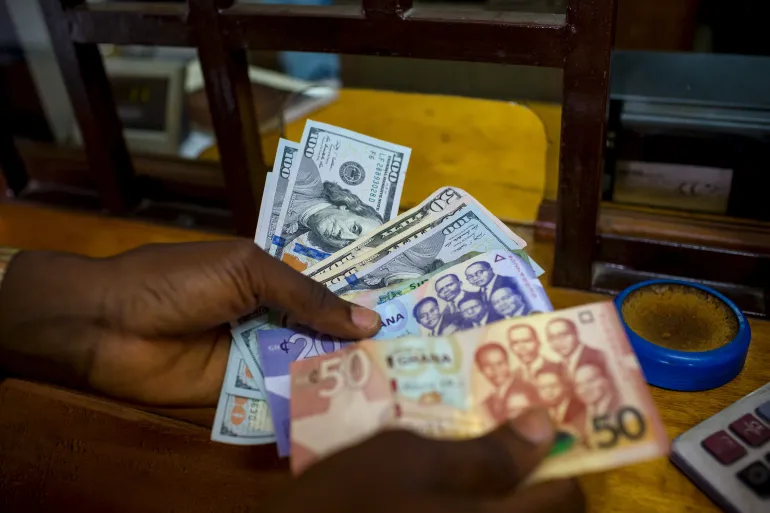














Every month, the Ghana Statistical Service releases numbers. Inflation fell to 25.8% in March 2024. GDP grew by 5.5% in the third quarter of 2025. The unemployment rate is low. But when you go to the market, prices still feel high. When you look for work, it is still hard. When you hear “the economy is growing,” you wonder whose economy is growing.
This gap between official statistics and lived experience is not necessarily a sign that the numbers are wrong. It is often a sign that the numbers are being misunderstood—or deliberately misused. This guide explains how to read government statistics critically, so you can tell the difference between a genuine signal and a misleading claim.
Quick Facts
-
Who produces official statistics: The Ghana Statistical Service (GSS) is the central body mandated to produce and disseminate official statistics, coordinating a network of institutions across the country .
-
Key economic releases: CPI (inflation) monthly, GDP quarterly and annually, and the Ghana Living Standards Survey (GLSS) periodically.
-
GDP revisions are normal: Initial GDP estimates are frequently revised as more complete data becomes available. The GSS revision policy allows revisions for up to two years .
-
Different measures, different stories: GDP measures production, but does not capture inequality, informal work, or household welfare .
-
Inflation is a rate of change: When inflation falls from 25% to 15%, prices are still rising—just more slowly .
The Golden Rule: A Statistic Is Not a Fact—It Is an Estimate
The first thing to understand is that no statistic is a perfect representation of reality. Every number is a measurement—an attempt to capture something complex using a tool that has limitations.
The GSS itself acknowledges this. Its Report Writing Style Guide states that statistics must be presented with “clear information on the definition of concepts, how the statistics were computed, the data source, how the data was collected, when the data was collected, and who the findings are applicable to” . If any of these elements are missing, you should treat the number with caution.

When you see a statistic, ask: What exactly is being measured? For whom? And by what method?
GDP: Growth Does Not Mean Prosperity
Gross Domestic Product (GDP) is the total value of goods and services produced in the economy. When the GSS reports that GDP grew by 5.5%, it means the economy produced more than it did in the previous period.
But here is the crucial limitation: GDP measures production, not distribution, and not wellbeing . A country can have strong GDP growth while most households feel worse off.

Consider what happens if growth is concentrated in mining or oil—sectors that employ relatively few people and generate profits that flow to a small number of owners and foreign investors. The GDP figure rises, but wages do not. The statistic is accurate, but it tells you nothing about whether ordinary Ghanaians are better off.
The World Bank has noted that even when macro data and household survey data appear to tell different stories, this does not necessarily mean one is wrong. A careful comparison of Ghana’s national accounts and the Ghana Living Standards Survey found that consumption growth from macro data (37.0%) and micro survey data (35.5%) were broadly consistent . The apparent gap was not evidence of manipulation, but of the different things each measurement captures.
The lesson: GDP growth is a signal about economic activity. It is not a measure of your living standards.

GDP Revisions: Why the Number You Heard Last Month Changed
One of the most confusing things about economic statistics is that they change. A figure released in March may be different by June. This can look like manipulation. It is usually something more mundane: revision.
The GSS has a formal revision policy. The Monthly Index of Economic Growth (MIEG) and quarterly GDP estimates “remain open to revisions for up to two years” as new data becomes available . When the annual GDP estimate is published each March, the quarterly and monthly figures that make up that year are revised as part of a “standard benchmarking procedure” .
There is also a technical reason for revisions: quarterly and annual estimates are sometimes compiled using different methods and data sources. As the GSS explains, “annual estimates of nominal GDP are not computed as the sum of the four quarterly estimates for the year but on the basis of detailed industry data compiled from more comprehensive data sources” . The two sets of numbers must be reconciled—and that reconciliation changes the figures.
The lesson: A revised statistic is not necessarily a corrected lie. It is often a more accurate estimate based on better data.
Inflation: Falling Is Not the Same as Falling Prices
This is perhaps the most misunderstood statistic in Ghana.
Inflation is the rate at which prices are rising. When the GSS reports that year-on-year inflation was 25.8% in March 2024, it means that the general price level was 25.8% higher than it was in March 2023 . The number is a measure of change, not of price levels.
When inflation falls from 25% to 15%, prices are still rising. They are rising more slowly, but they are not falling. A loaf of bread that cost GH¢5 when inflation was 25% does not become cheaper when inflation drops to 15%. It simply becomes more expensive at a slower rate .
There is also the question of whose inflation is being measured. The CPI is based on a “representative basket of goods” for Ghanaian households . But no single basket represents every household. As the GSS notes, “every Ghanaian has their own consumption pattern and so their own inflation rate” . If you spend a large share of your income on food, and food inflation is higher than headline inflation, your personal experience of inflation will be worse than the official number suggests.
The lesson: Falling inflation does not mean lower prices. It means prices are rising more slowly. And the official rate may not reflect your personal experience.
Unemployment: The Statistic That Hides More Than It Reveals
Ghana’s official unemployment rate is often reported as low—sometimes in the single digits. This seems to contradict the lived experience of many young Ghanaians struggling to find work.
There is a technical reason for this gap. In economies with large informal sectors, official unemployment figures “are mostly made up of formal unemployment” and “do not fully capture the number unemployed within the informal sector” . A person who works a few hours a week selling goods in a market may be counted as “employed” even if they are seeking more stable work. A person who has given up looking for work may not be counted at all.
This does not mean the statistic is fabricated. It means it measures a specific concept—formal unemployment—that does not match the broader reality of joblessness and underemployment.
The lesson: When you hear an unemployment rate, ask: Who is counted as employed? Who is excluded? What does “work” mean in this survey?
The Distinction Between “Percent” and “Percentage Points”
This is a small but critical distinction that is frequently abused.
If a candidate’s support rises from 40% to 45%, that is a 5 percentage point increase. But it is a 12.5% increase in relative terms (5 is 12.5% of 40).
Politicians and commentators often conflate these terms, sometimes deliberately. A headline saying “unemployment fell by 2%” could mean the rate dropped from 10% to 8% (2 percentage points), or it could mean the rate dropped from 10% to 9.8% (a 2% relative decline). The difference is enormous.
The GSS style guide explicitly distinguishes between percentages and percentage points in its reporting guidelines.
The lesson: Always check whether a change is described in percentage points or relative percentages. The first is usually more meaningful for understanding real-world change.
The Source Matters: Who Produced the Number?
Not all statistics are equal. The GSS is the official producer of statistics, coordinating the National Statistical System. Its releases follow documented methodologies and are subject to quality assurance.
But statistics also come from other sources: ministries, research institutions, international organisations, and political parties. Each may have different methodologies, different incentives, and different levels of transparency.
The GSS style guide states that “all official statistics presented must be related to previous, current, and future statistics and benchmarked with other statistics” . When statistics are not comparable—when a new methodology is introduced, for example—”a detailed explanation of the data collection processes, the sample characteristics, and the limitations must be clearly provided” .
The lesson: Check the source. Prefer official statistics from the GSS or other bodies with documented methodologies. Be skeptical of numbers that appear without explanation of how they were produced.
The Context Matters: A Number Without Context Is Meaningless
A statistic without context is like a sentence without a verb. It does not tell you what is happening.
The GSS style guide requires that “all statistics must be presented with the appropriate contextual information” and that “findings must be comprehensive and should not leave out pertinent information that will prevent readers from gaining an accurate understanding” .
When you see a number, ask:
-
Compared to what? Is this number high or low relative to history, to other countries, to the same period last year?
-
For whom? Is this a national average that hides regional or demographic differences?
-
Measured how? What is the methodology? What are the limitations?
The lesson: A number alone is not information. It becomes information only when placed in context.
Frequently Asked Questions
Why do government statistics sometimes not match my experience?
Statistics measure specific concepts—like formal unemployment or average inflation—that may not capture your individual experience. Regional differences, income differences, and informal sector activity can all create gaps between official numbers and lived reality.
Can I trust Ghana Statistical Service data?
The GSS is the official statistical authority with documented methodologies and quality assurance procedures. Its data is generally reliable, but like all statistics, it has limitations that must be understood .
Why does GDP grow while people still feel poor?
GDP measures total production, not distribution or wellbeing. Growth can be concentrated in sectors that employ few people or generate profits that do not flow to ordinary households.
What does it mean when inflation falls?
It means prices are rising more slowly. It does not mean prices are falling. A lower inflation rate still means the cost of living is increasing.
Why do GDP numbers change after they are published?
GDP estimates are revised as more complete data becomes available. The GSS revision policy allows revisions for up to two years as part of standard statistical practice .
What is the difference between percent and percentage points?
A change from 10% to 12% is a 2 percentage point increase, but a 20% relative increase. The distinction matters for understanding the real magnitude of change .
How does the informal sector affect economic statistics?
Ghana’s large informal sector makes it difficult to measure economic activity accurately. Unemployment figures, in particular, may understate joblessness because informal work is not fully captured .
What should I look for in a credible statistic?
Clear definition of the concept, explanation of the data source and method, appropriate context, and transparency about limitations .
What to Remember
Government statistics are tools, not truths. They are estimates produced by measuring complex realities with imperfect instruments. They can be accurate and still mislead if you do not understand what they measure.
GDP measures production, not wellbeing. Inflation measures the rate of price change, not price levels. Unemployment measures a specific concept that may exclude many people who are struggling to find work.
The GSS produces reliable data, but that data is only useful if it is interpreted correctly. When you see a statistic, ask: What is being measured? For whom? How? Compared to what?
The numbers matter. But understanding what they actually tell us—and what they do not—matters more.
Source: The Accra Daily Mail

Samuel Kwame Boadu is a Ghanaian media entrepreneur and storyteller with a passion for amplifying urban voices and uncovering everyday truths. He is the Editor-in-Chief and Founder of The Accra Daily Mail, a dynamic digital platform dedicated to capturing the pulse of Ghana’s capital—its people, culture, challenges, business, sports and innovations.